> For the complete documentation index, see [llms.txt](https://docs.intelligems.io/llms.txt). Markdown versions of documentation pages are available by appending `.md` to page URLs; this page is available as [Markdown](https://docs.intelligems.io/analytics/overview/experiment-analytics/statistical-significance.md).
# Statistical Significance
Intelligems uses a Bayesian statistical model and Monte Carlo simulations to analyze A/B tests. Note that the model does not account for intra-week (daily) seasonality, or other store-specific factors. We recommend that in addition to using Intelligems' provided probabilities to determine the significance of your test, you also ensure the test reaches a pre-defined minimum number visitors, orders, and full weeks live.
**A best practice is to set a minimum number of visitors, orders, *****and***** time** before ending a test or analyzing results.
**Recommended minimums:**
* **300+ orders per test group** (e.g., 300 in control, 300 in variant)
* **7+ days** (at least one full week to capture weekly patterns)
Once your test has reached these minimums, you can use the Stat Sig information in the analytics dashboard in the app to get a read on confidence in the results. Note that meeting these minimums does not guarantee statistical significance - it provides enough data for the Bayesian model to produce reliable probability estimates.
## Probabilities and Confidence Intervals
Within Intelligems analytics, you’ll see a few metrics derived from this statistical model:
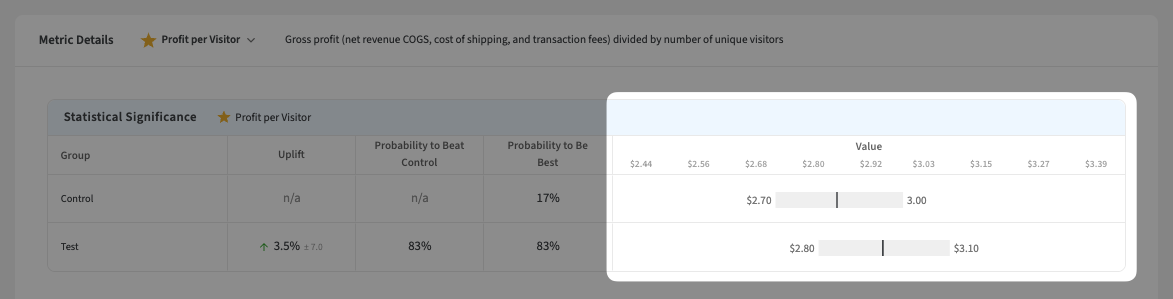
* **Probability to beat control**: this is the probability that a test group is better than the control group, on the basis of the selected metric
* **Probability to be best**: this is the probability that a test group is best, on the basis of the selected metric. In tests with a control group and only one other test group (i.e., A vs. B), the probability to be best will equal the probability to beat control
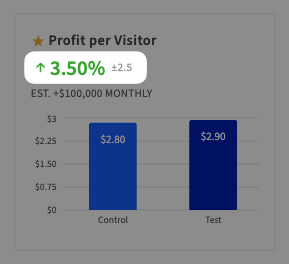
* **Uplift confidence interval**: this is a 95% confidence interval around the uplift percent (i.e., what percent better or worse a test group is vs. control for a specific metric). For example, in this screenshot, the uplift for profit per visitor is +3.50% +/- 2.50. This means the 95% confidence interval around profit per visitor uplift is \[+1.00%, 6.00%], that is, there is a 95% probability that the “true” profit per visitor difference is between +1.00% and +6.00%.
* **Value confidence interval**: this is a 95% confidence interval around the value measurement for a specific metric. There is a 95% probability that the “true” value of the metric for the test group lies in this interval.
As your experiment accumulates more data, the confidence intervals around uplift and value will narrow. Note that your experiment may reach statistical significance (i.e., the probability to be best or beat control is above a threshold, like 95%), but the confidence interval around uplift and value may still be very wide. This is because for a test group to have a high probability to be best/beat control, we only need high confidence that the uplift for that test group is > 0%. We may have high confidence that one test group is better than another, but still need to collect more data to have a good specific estimate of how much better.\
## Automated Test Verdict
In addition to the raw probabilities and confidence intervals above, Intelligems can return an automated test verdict — a single, actionable read on a test that combines statistical significance with stability (how settled the result has been over recent days). This is an opt-in feature available through the external API: pass `"testResult": true` in the request body when fetching experience data.
The verdict only computes once a test has accumulated enough data to be read reliably — roughly the same baseline minimums recommended above, in terms of both time live and orders per test group. Until then (or if the data is too thin to read), the verdict is `not_ready`. When a test is ready, the verdict is one of:
* `strong_win` / `strong_loss` — the best performing variant's probability to beat control on the primary metric is decisively high or decisively low.
* `directional_win` / `directional_loss` — the best performing variant's probability to beat control is leaning clearly in one direction and the result has held steady over recent days. This catches likely winners and losers that are not yet fully conclusive but are pointing consistently the same way.
* `mixed_signals` — the primary metric and other key metrics disagree (e.g., the variant wins on conversion but loses on revenue per visitor), so there is no clean call to make.
Actionable verdicts also include supporting detail to explain the call: a plain-language `action_to_take`, the `primary_metric` with some Bayesian statistics of its best-performing challenger variant and any `conflicting_metrics` that drove a `mixed_signals` result.
{% hint style="info" %}
The verdict is a convenience layer on top of the statistics described above — it does not change how significance is calculated. Treat it as a starting point for automated alerting and reporting, not a replacement for reviewing the full results.
{% endhint %}
---
# Agent Instructions
This documentation is published with GitBook. GitBook is the documentation platform designed so that both humans and AI agents can read, navigate, and reason over technical content effectively. Learn more at gitbook.com.
## Querying This Documentation
If you need additional information that is not directly available in this page, you can query the documentation by asking a question.
Perform an HTTP GET request on the following URL with the `ask` and `goal` query parameters:
```
GET https://docs.intelligems.io/analytics/overview/experiment-analytics/statistical-significance.md?ask=&goal=
```
`ask` is the immediate question: it should be specific, self-contained, and written in natural language.
`goal` is what the user is ultimately trying to achieve, the reason they need the answer. Sharing it helps GitBook give you a better, more relevant answer. A goal is most helpful when it describes the outcome the user wants rather than restating the question. For example, with `ask=how do I create an API token`, a goal like `automate deployments from our CI pipeline` lets GitBook tailor the answer to that use case.
The response will contain a direct answer to the question and relevant excerpts and sources from the documentation.
Use this mechanism when the answer is not explicitly present in the current page, you need clarification or additional context, or you want to retrieve related documentation sections.